Lesson 5 — Intermediate
Seaborn se Statistical Plots — Heatmap aur Regression
Matplotlib me sab manually set karna padta hai. Seaborn ek function me title, palette, grid aur statistics ke smart defaults de deta hai. Is lesson me do powerhouse plots banayenge — correlation heatmap aur regression scatter.
Seaborn vs Matplotlib
WHAT
Seaborn = Matplotlib ka statistical wrapper. Default palettes, automatic legends, DataFrame column names se direct plotting (x="col") — 5 line me complete chart.
WHEN
EDA me: correlation dekhna, category distributions compare karna, relationship + uncertainty (CI) dikhana. Publication-grade stats plots quick banane ho.
WHERE
EDA reports, deck visuals, ML assumption checks (multicollinearity heatmap). Seaborn ka output Matplotlib axes hi hai — customisation sab possible rehti hai.
Theme setup
import seaborn as sns
import matplotlib.pyplot as plt

sns.set_theme(style="darkgrid", palette="viridis")

# Dark custom theme (jaise hum use karte hain)
BG = "#0d0d1c"
sns.set_theme(style="whitegrid", palette="deep")
plt.rcParams.update({
    "figure.facecolor": BG, "axes.facecolor": BG,
    "axes.edgecolor": "rgba(255,255,255,.2)",
    "axes.labelcolor": "#8a8aa3", "text.color": "white",
    "xtick.color": "#8a8aa3", "ytick.color": "#8a8aa3",
    "grid.color": "rgba(255,255,255,.08)",
    "font.family": "sans-serif"})

# Palette: 3 colours jo hamare brand se match karte hain
PALETTE = ["#f0a500", "#8b5cf6", "#2dd4bf"]
sns.set_palette(PALETTE)
Correlation heatmap
import pandas as pd
import numpy as np

np.random.seed(7)
data = pd.DataFrame({
    "ad_spend":   np.random.rand(300) * 50,
    "price":      500 + np.random.rand(300) * 300,
    "delivery_h": np.random.rand(300) * 10})
# relationships inject karte hain
data["sales"] = (data["ad_spend"] * 8 - data["price"] * 1.5
                 - data["delivery_h"] * 12 + np.random.randn(300) * 20 + 400)

corr = data.corr(numeric_only=True)

fig, ax = plt.subplots(figsize=(8, 6), facecolor=BG)
sns.heatmap(corr, annot=True, fmt=".2f", cmap="viridis",
            linewidths=1, linecolor=BG, ax=ax,
            annot_kws={"size": 11})
ax.set_title("Feature Correlation Matrix", color="white", fontsize=15)
plt.tight_layout(); plt.show()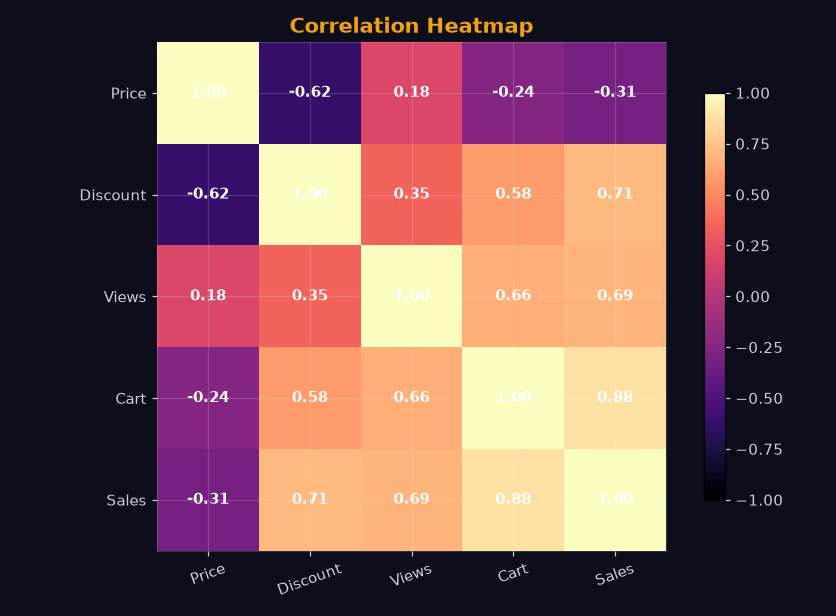
Scatter + regression line
fig, ax = plt.subplots(figsize=(9, 5), facecolor=BG)
sns.regplot(data=data, x="price", y="sales",
            scatter_kws={"alpha": 0.45, "color": "#2dd4bf", "s": 42},
            line_kws={"color": "#f0a500", "linewidth": 2.5},
            ax=ax)
ax.set_title("Price vs Sales (with 95% CI)", color="white", fontsize=15)
ax.set_xlabel("Price (₹)", color="#8a8aa3")
ax.set_ylabel("Sales", color="#8a8aa3")
plt.tight_layout(); plt.show()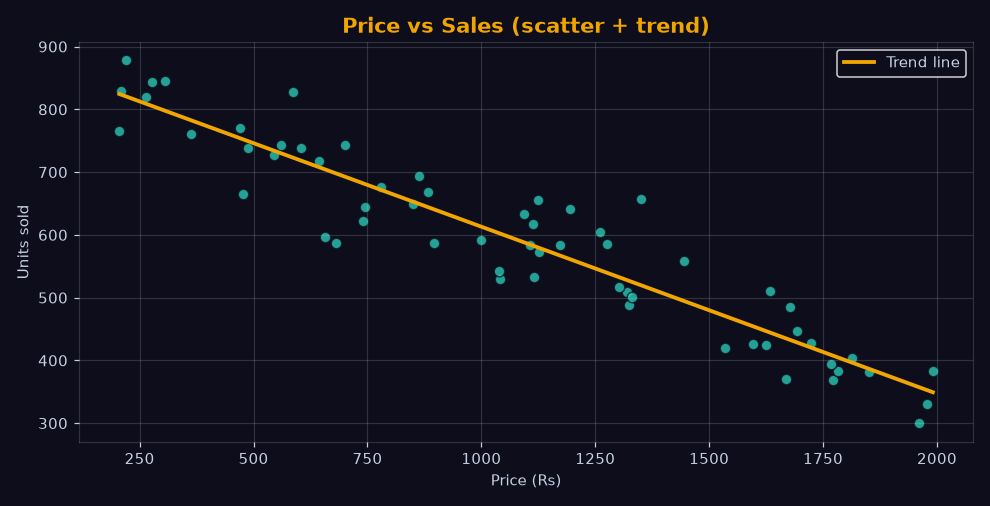
Plot selection — quick reference
- corr mat →
sns.heatmap(corr, annot=True) - do numeric ka relationship →
sns.regplot(line + CI), sirf points →sns.scatterplot - category distribution →
sns.boxplot/sns.violinplot - count per category →
sns.countplot - pairwise relations →
sns.pairplot(df)(EDA ka shortcut) - time trend multi-series →
sns.lineplot(data=df, x="date", y="v", hue="city")
Exercise
Question: Correlation matrix ko color blocks me dikhane wala seaborn plot? (7 letters)
Question: Scatter ke saath regression line khud draw karne wala seaborn function? (7 letters)
Common mistakes
- annot ke bina heatmap: Values na ho to interviewer number padh nahi pata — EDA me
annot=Truedefault rakho. - Poor color choice: Rainbow/viridis heatmap achhi, red-green colorblind-hostile combos avoid karo.
- Overplotting: 50k points ke scatter me alpha (transparency) do warna solid block ban jaata hai.
- CI miss:
regplotka band 95% confidence hai — report me isi ko "statistical strength" kehte hain.
Lesson ho gaya? Ab next pe chalte hain — Sales EDA Project.